
Make your Discovery.
Once price has been categorized as Discovery (potential downward trends), you're provided with a color classification that will help predict rebounds from lows, range bound moves, and label areas where price could continue to collapse. Each color is also linked to our Smart Get-Outs which predict when price may drop.
Discovery is currently only available through our consulting program. To learn about consulting click HERE.
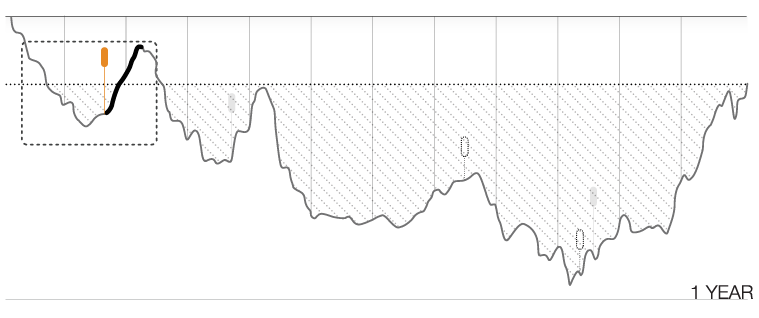
ORANGE
Orange signals represent price rebounding from extreme lows after large movements down from major highs. Although currently in Discovery, the security has a high probability of rebounding back to Endeavor once its trigger point (TP)* has been crossed.


PURPLE
Purple signals represent price rebounding from extreme lows after a dramatic movement down. While in Discovery, the security has a high probability of rebounding quickly; although not up to Endeavor, once its trigger point (TP)* has been crossed.


GRAY
Gray signals represent price rebounding from a bottom after a long extended movement down which usually lasted for multiple months. While in Discovery, the security has a high probability of beginning its upward movement, although not to Endeavor, once its trigger point (TP)* has been crossed. Price may continue moving erratically for the length of the trade.


*TP – A price that if crossed, confirms the signal. No action should be considered until the TP is crossed.